![]() Accepted
Accepted
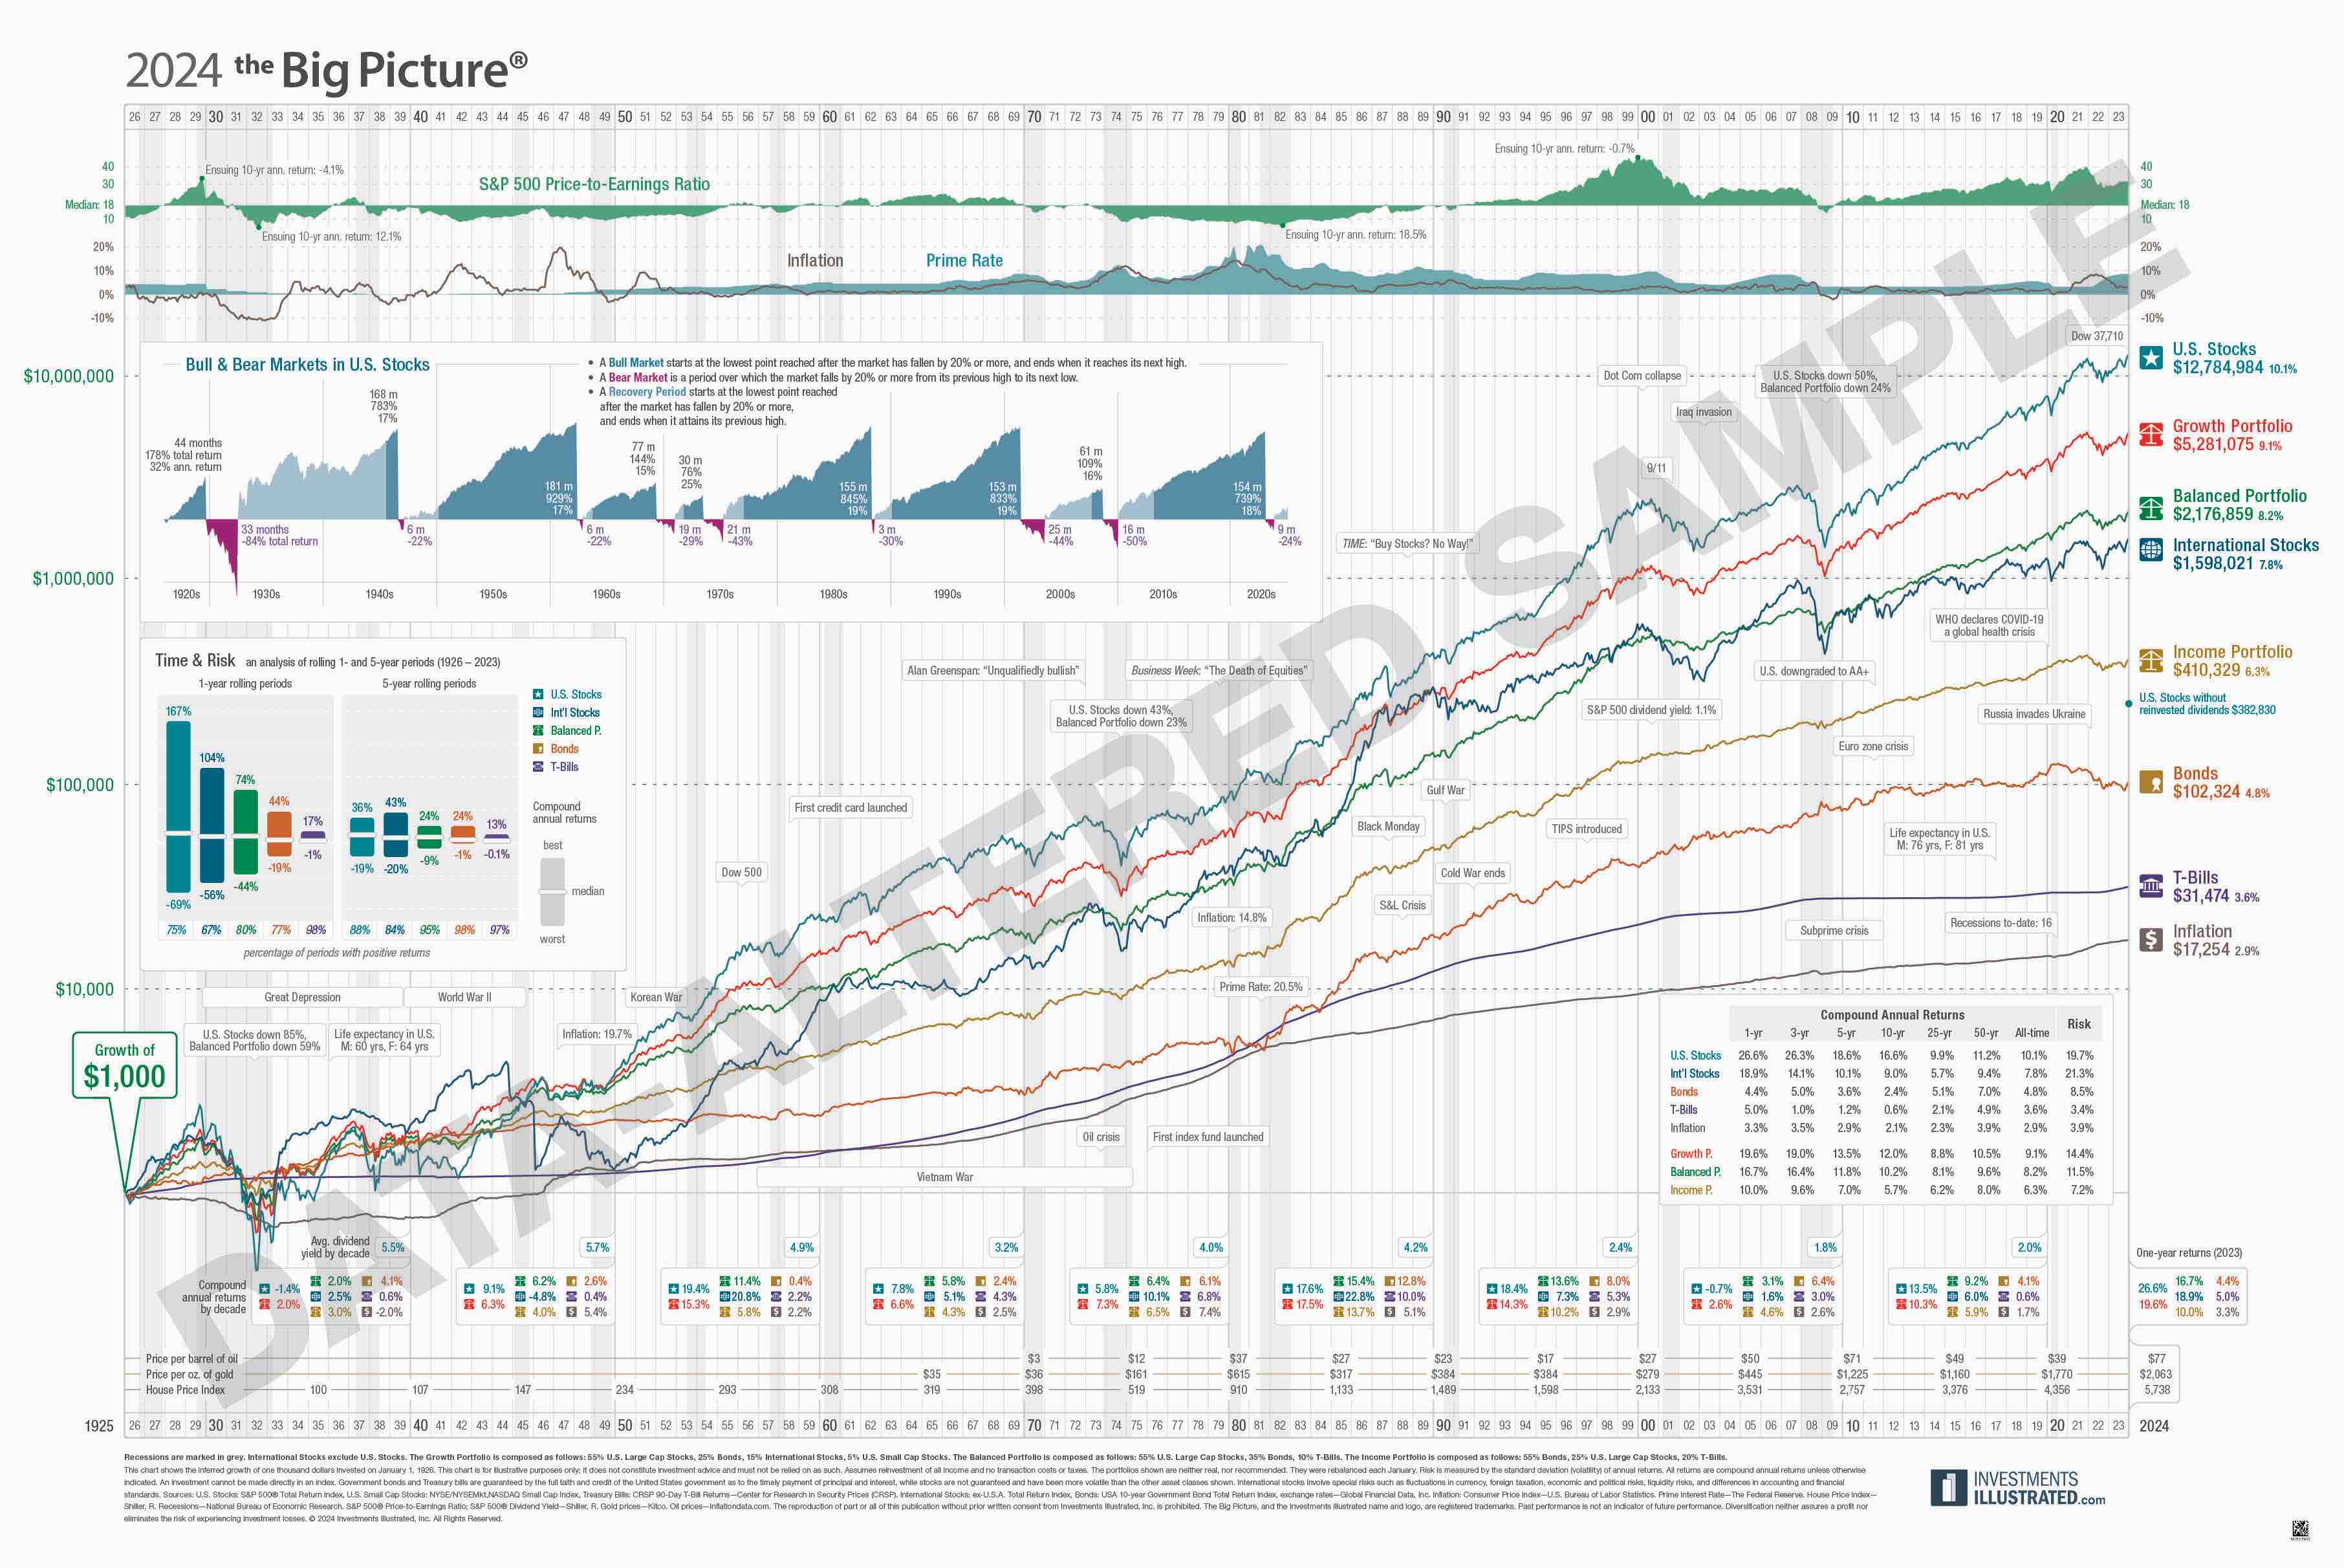
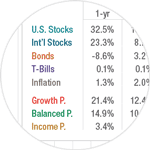
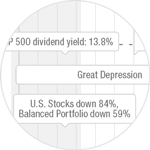
Equities have outperformed other asset classes, but at commensurately high risk. When stocks have fallen, a balanced portfolio has always fallen less.

Over the past 98 years, an investment in U.S. stocks has grown over 12,000-fold despite 16 recessions, double-digit interest rates, and several world crises.
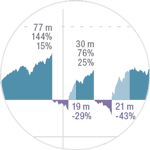
Stocks have fallen by over 20 percent on eight occasions since 1926. Following each downturn, they have recovered and gone on to reach new highs.
Growth versus peace of mind: How various investment strategies have stacked up over time.
Investment performance is linked to broader trends, including recessions, political events, interest rates, and housing, gold, and oil.

One dollar today is worth only a fraction of what it was in 1926. Domestic equities have outgrown inflation by a factor of 741.
*Handout
The Big Picture handout is an ideal take-home piece for your clients.
On reverse: the popular Time and Risk sub‑chart shows that the longer the investment holding period, the lower the historical likelihood of loss.
The Big Picture, and the Investments Illustrated name and logo,
are registered trademarks.
© 2024 Investments Illustrated, Inc.